GenBI - one-click dashboards with generative AI and BI-as-code

How LLM code generation speeds up dashboard creation
Rill’s vision is not only to deliver blazingly fast dashboards for end users, but to make the act of creating dashboards fast for developers. Below, we show how Rill Developer, Rill’s open-source IDE, uses AI to transform an S3 data source into an operational dashboard in one click.
We’re thrilled to introduce this creative magic in today’s newest 0.41 release of Rill, which is made possible by combining two powerful ideas:
- Rill’s BI-as-code philosophy means dashboards are defined entirely in code
- Large language models, like OpenAI’s GPT series, excel at code generation
Rill’s operational dashboards put time-series metrics and dimensions at the center. These are metrics like total revenue, user count, or average revenue per user, which are aggregate measure expressions in SQL. [1]
Given the massive corpus of openly available developer code that large language models (LLMs) have been trained on, prompting an AI to generate syntactically correct SQL expressions for these aggregate measures is straightforward. LLMs have scoured millions of StackOverflow posts so you don’t have to.
Things to know
Incorporating code generation into development environments is not a gimmick, but a trueproductivity accelerator, as evidenced by the impact and success of GitHub Copilot.
- Beyond generating BI-as-code with this OpenAI integration, Rill Developer also provides software engineers a fast feedback loop to rapidly edit the code, visualize metrics, and
- instantly preview dashboards before deploying them into Rill Cloud or a self-managed environment.
OpenAI + BI-as-code: a synergistic architecture
In Rill, dashboards are defined by a combination of SQL and YAML files, which contain a list of dimensions and measures. Measures are defined by four fields:
- Name: A distinctive name for the measure.
- SQL expression: The SQL command used for measure evaluation.
- Label: A user-friendly, succinct label for end-user display.
- Description: An elaborate explanation of the measure.
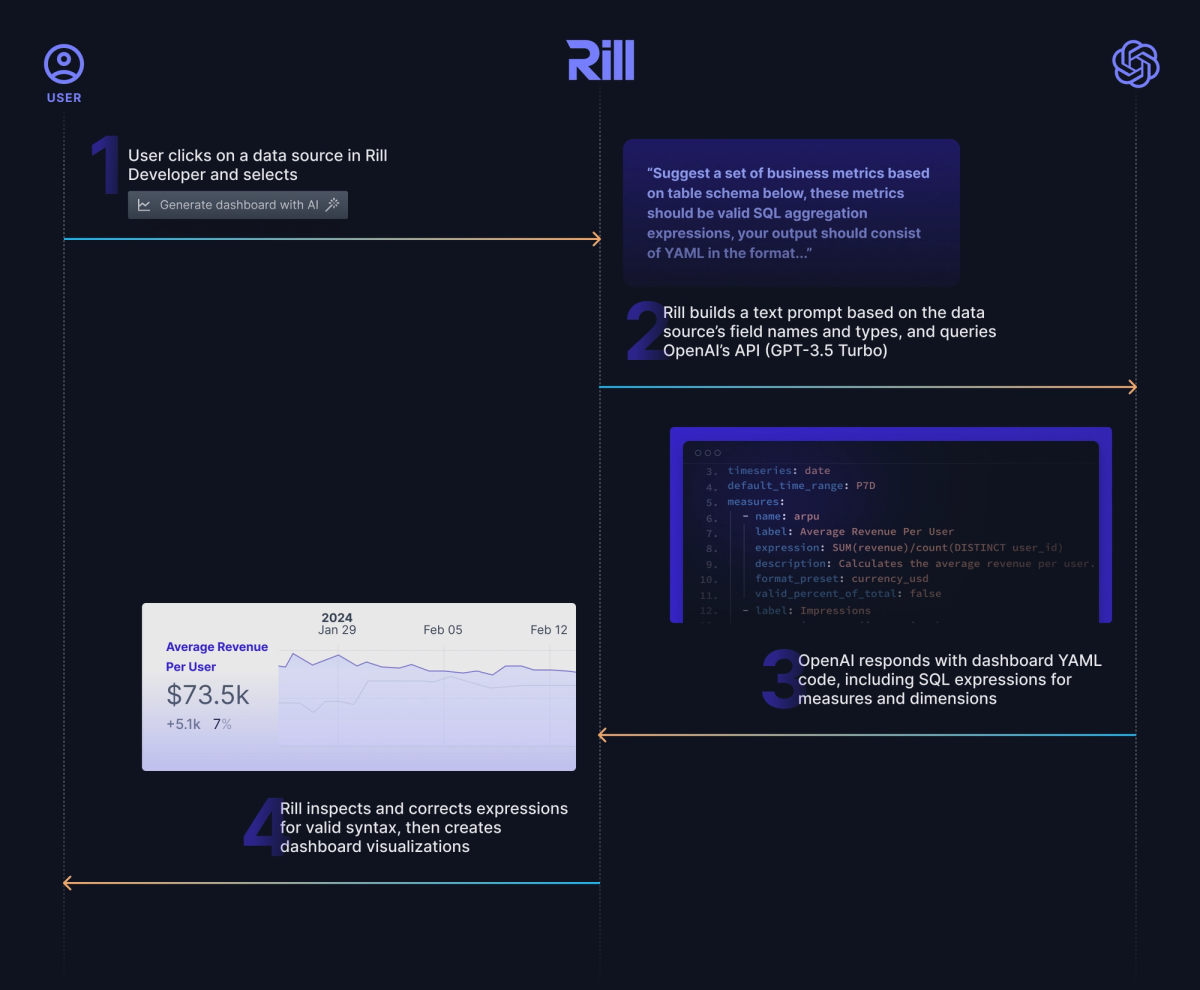
Below we illustrate the four-step flow that we implemented to enable OpenAI’s GPT-3.5 Turbo to programmatically generate the dashboard YAML spec that underlies Rill’s dashboards.
Our learnings: Trust but validate generated code
Our initial findings revealed that OpenAI models can process a dataset with 50 columns in approximately 10-20 seconds, suggesting up to 10 measures. However, not all suggested measures are valid, primarily due to invalid SQL expressions or non-compliance with the specific SQL dialect of the underlying OLAP engine.
To address this, we introduced a validation phase where we validate by preparing a query against the OLAP engine and refine any invalid AI-generated measures. This ensures the final architecture always produces accurate and valid dashboard specifications.
Future directions
The integration of OpenAI into Rill Developer highlights our dedication to finding leading edge technologies to radically simplify the data-to-dashboard journey. Want to see a list of suggested business KPIs you should add to your dashboards? You can get started in less than two minutes with our install script below, connect with us in our Discord channel to share your feedback.
{{code-block}}
Notes
[1] Language choice matters because the training data for widely adopted languages like SQL is larger, thus LLMs are better at generating BI-as-code in SQL than DAX, LookML, or VizSQL. This is why our friends at Omni embraced a dialect of Excel and Google Sheets’ expressions for their calculations feature .


